Mobile Site
Cardinal Surveys Company
The value of our services far
exceeds the cost.
| Odessa, TX |
Phone (432) 580-8061 |
Fax: (432) 580-0547 |
| Hobbs, NM |
Phone: (575) 397-1069 |
Fax: (575) 393-5836 |

Welcome to Cardinal Surveys Company's Home Page. Our intent is to construct a web site
that will be useful to any petroleum professional in the oil and gas industry who is
interested in production logs, injection profiles, radioactive tracers, radiation safety,
and after stimulation logs. You will find information on preparation, general procedures,
safety, and regulatory concerns.
This site was designed to be compatible with both Netscape Navigator and Microsoft
Explorer, and now Mozella Firefox. Graphics have been kept as small and simple as possible to reduce dead time at
our site.
Services Offered
- ANNULUS TRAC-III
- Annulus Production Logging on pumping wells. The 7/8" O.D.
logging tool string allows us to travel down the tubing annulus and document producing
conditions on a real time basis.
- FLOWING TRAC-III
- Production Logging on flowing wells.
- TAGMASTER
- High pressure tagging system that injects radioactive material down stream of all pumps,
blenders, and manifolds.
- GAMMA-TROL II
- Temperature and Gamma Ray Log used to determine the placement of well stimulations and
treatments.
- INJECTION PROFILE
- Used by the oilfield industry to determine the destination of injected fluids in
secondary and tertiary flood projects. Profiles are also used by chemical and other
industries to confirm wastes are being injected safely in appropriate zones in hazardous
waste wells.
- INTERFACE LOG
- Proven method for accurately controlling placement of profile modification sealants and
treatment chemicals.
- GAMMA SpecTrol
- Spectral Gamma Ray logging used to determine the placement of well stimulations and
treatments traced with multi-isotopes.
- STEP
RATE TESTING
- Controlled injection rates while bottom-hole pressures are
measured and recorded are then plotted to show the Formation Parting
Pressure (FFP).
- PRESSURE TESTING (Pressure Transient
Analysis)
- Pressure Tools, Real-Time and Memory Gauge / Pressure analysis (build
up, fall off)
Other Services:
Memory
tool production logging - slick line or coiled tubing (CT) conveyed, high
temperature
Production Log Analysis, including calibrated
Water Cut, Absolute Fluid Entry Volumes
Velocity Calculator - Convert BPD to Linear Velocity!
Wolfberry and
unconventional production
logs: Zone-by-zone breakdown of production in wells
on rod pump artificial lift, even small casing sizes. 4 1/2" casing with 2
3/8" tubing have been successfully logged. Don't make guesses or
assumptions about your well, use the best available technology to scientifically
determine your well's performance. See link
above, Annulus Trac-III.
Cardinal Surveys
Company Safety Policies and Manuals
New Service
We are proud to announce a new
Log Archive Service. Every
finished log is now stored in PDF, and LAS format
in Cardinal's Log Archive
server located @
www.cardinallogarchive.com.

Find your log in the
Cloud! Contact a Cardinal Surveys sales representative for a user
name and password to access your data.
Webex
Web conferencing - we can meet with you personally on
your desktop! Go over your logs, discuss and evaluate in real time.
We simply arrange an appointment, and meet you virtually in your office
or anywhere you have internet access. We can share any document with you
electronically, and can include up to 25 of your associates, each from their
physical location, anywhere in the world.
cardinalsurveys.webex.com
Downloads
Webex for
Internet Explorer
Webex for
Firefox & Chrome
Spectral Gamma Ray Stimulation Evaluation:
Multi-channel gamma spectrum logging. Recognizes scandium, antimony, and iridium used
to trace stimulation fluids. May be run in conjunction with temperature logs. Merged and
analyzed data available in field immediately after logging passes are completed. Tool
size: 1 ¼ in. May be run as soon as stimulation treatment is completed. New,
improved analysis algorithm and simplified telemetry.
Coalbed Methane Wells:
 Production logs of coalbed methane (CBM) gas
producers.
The Annulus Trac III log is used to identify the actual productive zones,
and verify downhole mechanical configuration. In a recent application, 10
wells were logged using the exclusive 7/8"
O. D. logging tools. Modification of the down-hole configuration of one
well paid for the cost of logging all 10 wells in less than one month!
Further workovers are planned to increase
production for the lease based on the diagnostic results from the Trac III logs.
If you expect a continuing firming in the natural gas market place,
now is the time to diagnose and plan workovers for coal-seam wells!
Cardinal Surveys has more experience in logging
coalbed methane wells while under actual producing conditions than anyone in the
World.
Production logs of coalbed methane (CBM) gas
producers.
The Annulus Trac III log is used to identify the actual productive zones,
and verify downhole mechanical configuration. In a recent application, 10
wells were logged using the exclusive 7/8"
O. D. logging tools. Modification of the down-hole configuration of one
well paid for the cost of logging all 10 wells in less than one month!
Further workovers are planned to increase
production for the lease based on the diagnostic results from the Trac III logs.
If you expect a continuing firming in the natural gas market place,
now is the time to diagnose and plan workovers for coal-seam wells!
Cardinal Surveys has more experience in logging
coalbed methane wells while under actual producing conditions than anyone in the
World.
Food for Thought
on Technology...
When NASA first started sending up astronauts, they quickly
discovered that ballpoint pens would not work in zero gravity. To combat the
problem, NASA scientists spent a decade and $12 billion to develop a pen that
writes in zero gravity, upside down, underwater, on almost any surface including
glass and at temperatures ranging from below freezing to 300 Celsius.
The Russians used a pencil.
Insanity in individuals is something rare - but in groups, parties, nations
and epochs, it is the rule.
- Friedrich Nietzsche
(1844 - 1900)
Insanity: doing the same thing over and over again and expecting different
results.
- Albert Einstein, (attributed) (1879 - 1955)
Points Of Interest
 Cardinal Log
Archive
Cardinal Log
Archive
Example
Logs
- (All in Adobe .PDF format)
-
- Metric
Conversion Chart
- (Not what you'd expect!)
-
- He has the Knack!
- (Humorous, unless you're a sensitive engineer...)
-
- Literature (Adobe .PDF
Format) and Powerpoint!
- Includes link to Adobe's web site for free Adobe Acrobat® reader.
-
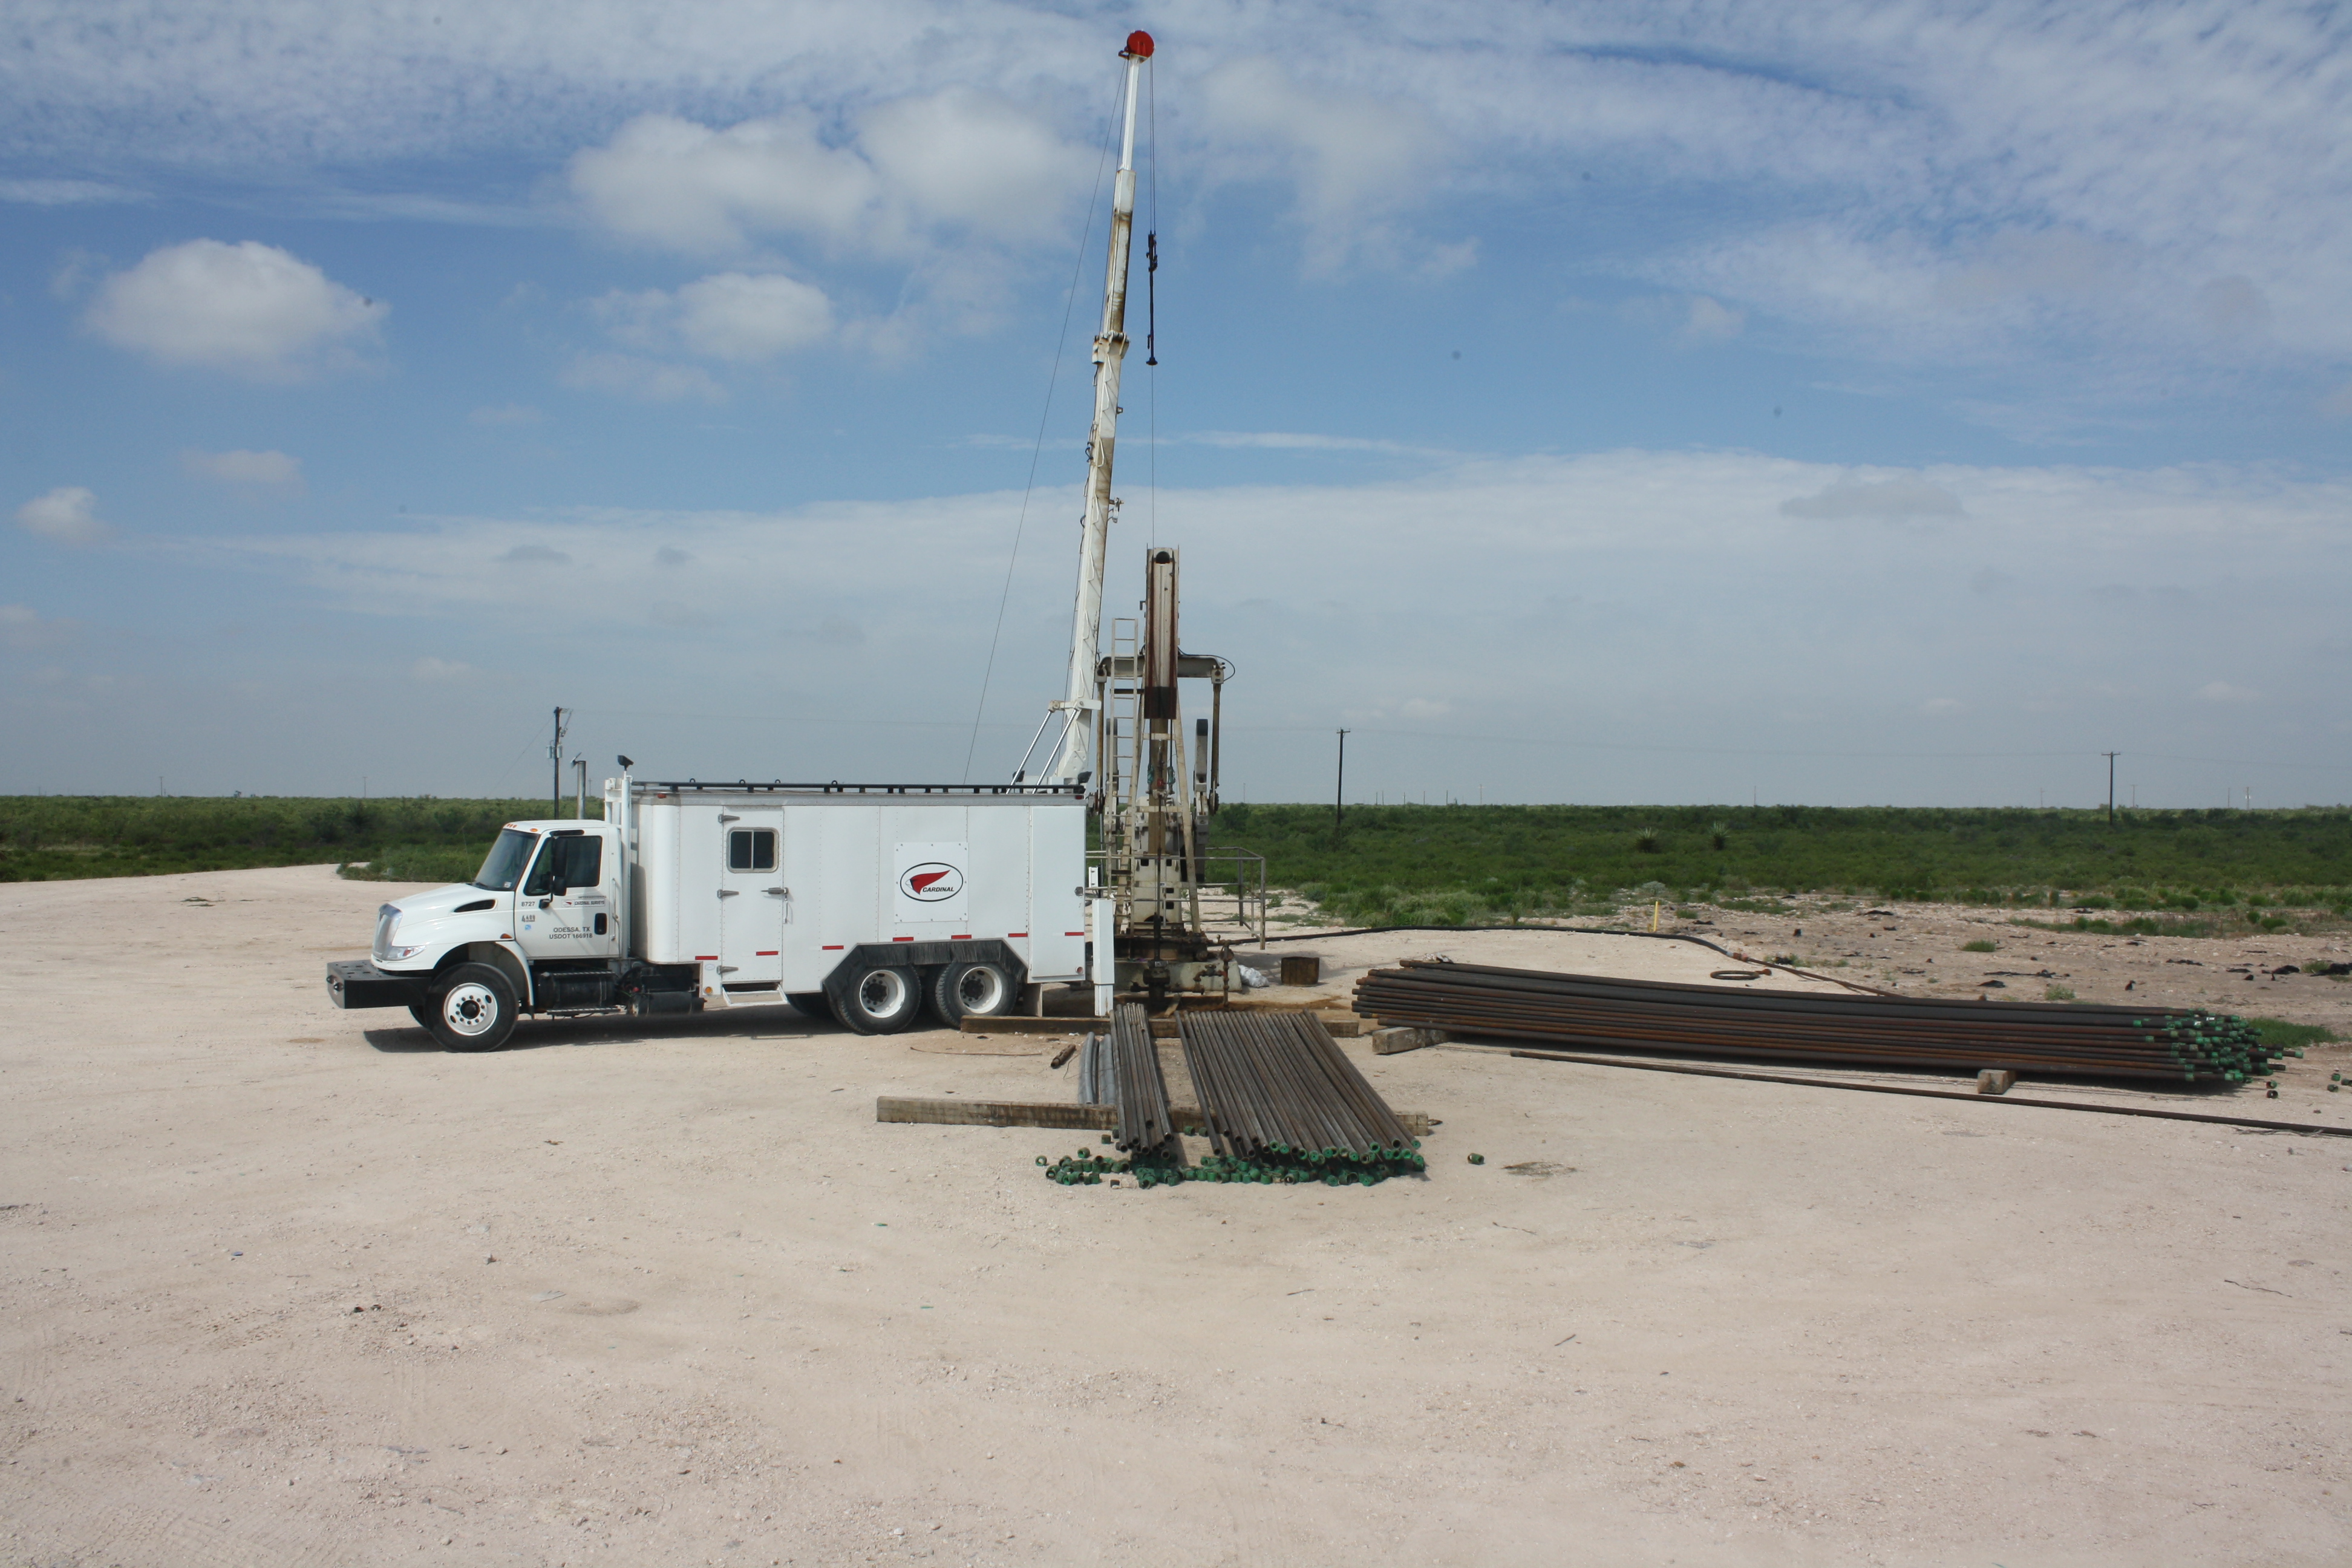
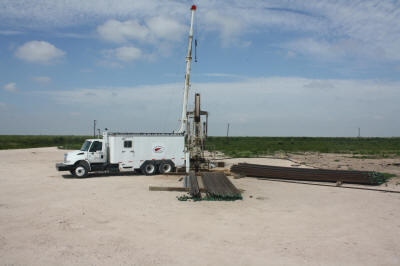
- Cardinal Surveys Photo
Gallery (New: 2006 Rock Springs, Wy)
- Photos of our people, equipment, and locations we've served on.
- Phillips Petroleum Company - DOE Oil Recovery Project
- We were selected to provide injection profile services on one of Phillips' horizontal
injection wells in the South Cowden Unit. Information on equipment, tools, procedures, and
log plots are included.
- RADIATION AGREEMENT
- Cardinal Surveys Company is required to have working agreements with all our customers
and fellow contractors concerning the proper proceedures and responsibilites for
radioactive materials used in our services
- FEED BACK AND E-MAIL LISTING
- Drop us a line if we can help you with a specific well problem or let us know what you
think about this site.
- RADIATION SAFETY & INFORMATION
- Basic radiation safety, information on radiation dosage, and other uses for radioactive
materials.
Look in the GLOSSARY for any definitions you may need.
Check out the Cool Links Page.
A little humor from Steven Wright.
More humor from Yogi Berra.
For 'tis the sport to have the engineer
Hoist with his own petard...
William Shakespeare, "Hamlet", Act 3 scene
4
Search the World Wide Web using the BEST search engine we know of:
.asp|Image=4) visits since August 1, 1998.
(Wow!)
visits since August 1, 1998.
(Wow!)

 Site designed
by Burl Wylie
Site Hosted By:
Site designed
by Burl Wylie
Site Hosted By: